Entity-Relationship Diagram#
Entity-Relationship Diagram (ERD) is a data modeling technique that graphically illustrates an information system’s entities and the relationships between those entities. It’s a conceptual and representational model of data used to represent the entity framework infrastructure.
Sample Database Application
- Company
Employees, departments, projects (tables)
Company is organized into departments
Department controls a number of projects
Employee: store each employee’s name, Social Security Number, address, salary, sex (gender), and birth date
Keep track of the dependents of each employee
Models of ERD#
A conceptual ERD is a high-level visual blueprint that maps out core business concepts and how they relate to one another, completely ignoring technical database details.
Core Components
- Entities
The main “nouns” or business projects you want to track.
- Relationships
The business connections or “verbs” linking those entities.
- No Technical Details
Leaves out attributes, primary keys, foreign keys, and exact data types.
Why It Matters
- Scope Definition
Helps project managers and stakeholders agree on what data the system needs before building anything.
- Platform Agnostic
Focuses purely on business rules and terminology rather than a specific database engine.
- First Step
Serves as the foundation before moving to more detailed logical and physical data models.
A logical ERD is an abstract representation of an organization’s data requirements. It focuses on the structure and relationships of data, independent of any technical constraints or specific database technologies. Logical models are primarily concerned with what data is needed and how it relates, rather than how it will be stored or accessed.
Key Components
- Attributes
Characteristics or properties of entities, such as
StudentID,FirstName, orDateOfBirth.- Business Rules
Logical models capture rules and constraints that reflect organizational policies, such as “a student can enrol in multiple courses, but each enrolment must be unique.”
- Cardinality
Define the numerical nature of the relationship.
- Data Integrity
Logical models define how data should be valid and consistent, for example, by specifying unique identifiers and mandatory fields.
- Documentation
Logical models are often depicted using diagrams, such as Entity-Relationship Diagrams (ERDs), which visually represent entities, attributes, and relationships.
- Entities
Represent real-world objects or concepts, such as
Student,Course, orEnrolment. Each entity has attributes (properties) that describe it.- Foreign Keys
Connect entities together by referencing a primary key in another table.
- Normalization
Organizes data to reduce redundancy and improve overall integrity.
- Primary Keys
Uniquely identify each specific record within an entity.
- Relationships
Connections between entities, such as a student enrolling in a course. Relationships can have their own attributes (e.g.
EnrolmentDate).- Technology Independence
Logical models do not specify how the data will be stored, making them adaptable to various database management systems.
Example
- Entity: Student
Attributes: StudentID, FirstName, LastName, DateOfBirth
- Entity: Course
Atributes: CourseID, CourseName, Credits
- Entity: Enrolment
Attributes: StudentID, CourseID, EnrolmentDate
- Relationship
Student enrols in Course (via Enrolment)
A physical ERD translates the logical model into a complete implementation within a specific database system. It addresses technical considerations, such as storage formats, indexing, data types, and security mechanisms, ensuring that the database performs efficiently and securely in the real world.
Key Elements
- Backup and Recovery
Physical models consider mechanisms for data backup, recovery, and disaster management to maintain reliability.
- Constraints
Physical models implement constraints such as
PRIMARY KEY,FOREIGN KEY,UNIQUE, andNOT NULLto enforce data integrity and relationships.- Data Types
Each column is assigned a specific data type (e.g.
INT,VARCHAR,DATE) to optimze storage and performance.- Indexes
Indexes are created to speed up queries and improve efficiency, especially for frequently searched columns.
- Junction Tables
Many-to-many relationships are broken down into physical junction tables containing foreign keys.
- Performance Optimization
Techniques such as query optimization, caching, and load balancing are implemented to ensure the database operates efficiently under varying loads.
- Security
Physical models specify across controls, user roles, and encryption to protect sensitive data and ensure compliance with organizational policies.
- Storage and Partitioning
The physical model may include strategies for partitioning tables or clustering data to enhance scalability and performance.
- Tables and Columns
Entities and attributes from the logical model become tables and columns in the physical model. For example, the
Studententity becomes aStudenttable with columns for each attribute.
Example
CREATE TABLE IF NOT EXISTS Student (
  StudentID INT PRIMARY KEY,
  FirstName VARCHAR(50) NOT NULL,
  LastName VARCHAR(50) NOT NULL,
  DateOfBirth DATE NOT NULL
);

CREATE TABLE IF NOT EXISTS Course (
  CourseID INT PRIMARY KEY,
  CourseName VARCHAR(100) NOT NULL,
  Credits INT NOT NULL
);

CREATE TABLE IF NOT EXISTS Enrolment (
  StudentID INT,
  CourseID INT,
  EnrolmentDate DATE,
  PRIMARY KEY (StudentID, CourseID),
  FOREIGN KEY (StudentID) REFERENCES Student(StudentID),
  FOREIGN KEY (CourseID) REFERENCES Course(CourseID),
  INDEX idx enrolment date (EnrolmentDate)
);
Logical vs. Physical Models#
Aspect |
Logical Model |
Physical Model |
|---|---|---|
Purpose |
Defines what data is needed and how it relates to business requirements |
Specifies how data is stored, accessed, and managed in a specific DBMS |
Technology Dependency |
Technology-independent; suitable for any DBMS |
Technology-dependent; tailored to a particular DBMS and hardware |
Focus |
Business rules, data integrity, relationships |
Storage structures, indexing, constraints, optimization, security |
Representation |
Entities, attributes, relationships (often diagrammed) |
Tables, columns, data types, indexes, constraints (often script/code) |
Security |
Defines access rules and required protections |
Implements access controls, encryption, and auditing |
Scalability |
Considers future data needs conceptually |
Implements partitioning, clustering, and load balancing for growth |
Quality & Reliability |
Ensures consistency and completeness of data requirements |
Implements backup, recovery, error handling, and monitoring |
Efficiency & Effectiveness |
Ensures correct data structure for business operations |
Optimizes queries, storage, and resource usage for performance |
Logical models ensure that all organizational data requirements are captured accurately and comprehensively. Physical models implement these requirements using best practices, reducing errors and inconsistencies.
Logical models provide a stable foundation for data integrity, while physical models include backup, recovery, and failover mechanisms to minimize downtime and data loss.
Logical models anticipate future growth by defining flexible structures. Physical models use partitioning, clustering, and distributed architectures to handle increasing volumes of data and users.
Logical models streamline data relationships and minimze redundancy. Physical models optimize data access through indexing, efficient queries, and resource management.
Logical models ensure the database supports business processes and decision-making. Physical models guarantee that the system delivers expected results quickly and reliably.
Logical models specify what data should be protected and who can access it. Physical models enforce these rules using authentication, authorization, encryption, and audit traits.
Analyzing an Existing Database System#
When analyzing an existing database system, it’s important to evaluate both its logical and physical models to determine how well they support organizational requirements for quality, reliability, scalability, efficiency, effectiveness, and security.
- Review the Logical Model:
Are all entities, attributes, and relationships clearly defined and documented?
Do business rules and data integrity constraints reflect organizational policies?
Is the logical model flexible enough to accommodate future changes?
- Examine the Physical Model:
Is the database structure optimized for performance, scalability, and reliability?
Are appropriate data types, indexes, and constraints implemented?
Does the physical model include adequate security measures, such as access controls and encryption?
- Evaluate Quality and Reliability:
Are there mechanisms for regular data validation, backup, and recovery?
Is data consistent, accurate, and complete across the system?
Are error rates and system downtime minimized?
- Assess Scalability and Efficiency:
Can the database handle increasing data volumes and user loads without degradation in performance?
Are queries and transactions processed efficiently, with minimal resource consumption?
Are there strategies for horizontal or vertical scaling?
- Check Effectiveness and Security:
Does the database system meet the operational and strategic needs of the organization?
Are security policies enforced, monitored, and regularly updated?
Is sensitive data protected against unauthorized access and breaches?
Steps in Creating an ERD#
Identifying and defining the identities.
Determining all interactions between the entities.
Analyzing the nature of interactions/determining the cardinality of the relationships.
Creating the ERD.
Components of ER Diagram#
ERD is used to represent the requirement analysis at the conceptual design stage. The database is designed from the ERD or ERD is converted to the database.
Each entity in the ERD corresponds to a table in the database. The attributes of any entity correspond to field (column) of a table. The ERD is converted to the database.
Entity#
An entity is a real-world item or concept that exists on its own. They are equivalent to database tables in a relational database, with each row of the table representing an instance of that entity. Entities are objects or concepts that represent important data. They are typically nouns (customer, supervisor, location, or promotion).
Types of Entities#
Strong entities exist independently from other entity types. They always possess one or more attributes that uniquely distinguish each occurence of the entity.
ER Diagram Representation: Single solid square.
Weak entities depend on some other entity type. They don’t possess unique attributes (also known as a primary key) and have no meaning in the diagram without depending on another entity. This other entity is known as the owner.
ER Diagram Representation: Double solid square.
Associative entities associate the instances of one or more entity types. They also contain attributes that are unique to the relationship between those entity instances.
ER Diagram Representation: Single solid squircle.
Attribute#
An attribute of an entity is a particular property that describes the entity. It’s the characteristics of either an entity, a many-to-many relationship, or a one-to-one relationship.
Attribute must have a value for every entity (or relationship) instance with which it is associated.
Attribute may not have a value for every entity (or relationship) instance with which it is associated.
Types of Attributes#
Attributes that are capable of taking in more than one value.
ER Diagram Representation: A double-lined ellipse.
Why Use It?
Captures real-world scenarios where an entity has a variable number of items for the same property.
Examples
A Person entity having multiple values for PhoneNumber (e.g. personal, work, mobile).
An Employee entity having multiple values for Skill or Degree.
Attributes whose value is not stored directly in the database, but instead calculated or derived from other stored attributes or system values.
ER Diagram Representation: A dashed ellipse.
Why Use It?
Eliminates data redundancy and prevents stale data (e.g. storing age directly requires updating it every year).
Examples
Age calculated from DateOfBirth and the current date.
TotalAmount calculated from Quantity multiplied by UnitPrice.
YearsOfService calculated from HireDate.
Attribute can be divided into smaller sub-parts, each with its own independent meaning.
ER Diagram Representation: Main ellipse connected to smaller component ellipses.
Why Use It?
Allows querying or organizing individual sub-components (e.g. searching by city) while maintaining cohesive unit.
Examples
Address broken down into Street, City, State, and ZipCode.
FullName broken down into FirstName, MiddleName, and LastName.
Used to represent Primary Key. An attribute (or combination of attributes) that uniquely identifies individual instances of an entity type.
ER Diagram Representation: An oval (ellipse) with underlined text connected to its entity rectangle.
Key Characteristics
- Uniqueness
Every instance of the entity must have a distinct value for this attribute; no two rows can share the same value.
- Non-null
An identifier cannot contain a null or empty value.
- Types
It can be a simple attribute (like a single
student_id) or a composite attribute made of multiple combined fields.- Discriminators
In weak entities, a partial identifier (or discriminator) is used alongside the parent entity’s key to uniquely identify records.
Relationship#
A relationship is the association that describes the interaction between entities. They are usually verbs, e.g. assign, associate, or track. A relationship provides useful information that could not be discerned with just the entity types.
Kinds of Relationships#
A connection between two independent strong entities where each entity has its own primary key.
ER Diagram Representation: Single solid line.
Or identifying relationships; are connections that exist between a weak entity type and its owner.
ER Diagram Representation: Single double line.
A single diamond-shaped connection that links three distinct entity types together. It is used when a normal two-way (binary) link cannot correctly show how all three things depend on each other at the same time.
Degree of Relationship#
The number of entity types that participate in it.
An association where a single entity type relates to instances of itself, giving it a degree of 1.
Key Characteristics
- Degree 1
Only one entity set participates in the relationship.
- Recursive
Also called a recursive relationship because the single entity references back to itself.
- Role Names
Different roles are often assigned to the participating instances to clarify how they interact.
Examples
An Employee managers another Employee (Supervisor vs. Subordinate).
A Person is married to another Person, or an Ancestor is a parent of a Person.
A relationship that has a degree of two, meaning it connects exactly two different entity types or sets.
Key Characteristics
- Degree
Always equal to 2
- Usage
It is the most common and widely used type of relationship in database design.
- Implementation
Easily mapped into relational table foreign keys.
Examples
A Student enrolls in a Course.
An Employee works in a Department.
A Customer holds an Account.
A single relationship set that simultaneously connects exactly three distinct entity types, giving it a degree of 3.
Key Characteristics
- Degree 3
Exactly three entity types participate in one joint relationship
- Complexity
It cannot always be accurately split into separate binary relationships without losing business logic or contextual constraints.
- Representation
Visualized in Chen notation as a diamond-shaped relationship box connected by lines to three distinct entity rectangles.
Examples
Doctor, Patient, and Medicine.
A Prescribes or Treats association where a specific doctor prescribes a specific medicine to a specific patient, linking all three elements together in one transaction.
Employee, Department, and Location (an employee works for a department at a specific location).
Cardinality#
The number of instances of one entity that can, or must, be associated with each instance of another entity. In general, there may be one-to-one, one-to-many, or many-to-many relationships.
Each entity in the relationship will have exactly one related entity.
An entity on one side of the relationship can have many related entities, but an entity on the other side will have a maximum of one related entity.
Entities on both sides of the relationship can have many related entities on the other side.

Source: jcsites.juniata.edu#
Cardinality Constraints#
Defines the numerical limits or associations between entity instances in a relationship.
The fewest number of times an instance must participate in a relationship, showing whether the relationship is optional or mandatory.
- Optional (Minimum = 0)
Participation is not required; an entity instance can exist without being linked (represented by a circle or dash depending on notation style).
- Mandatory (Minimum = 1)
Participation is required; an entity instance must be linked to at least one instance (represented by a tick mark or line).
The greatest number of times an instance of one entity can participate in a relationship with another entity.
- One-to-One (1:1)
One instance connects to only one other instance (e.g. a person and a passport).
- One-to-Many (1:M)
One instance connects to multiple isntances, but the reverse is single (e.g. a department has many employees).
- Many-to-Many (M:M)
Multiple instances on one side connect to multiple instances on the other side (e.g. students and courses).
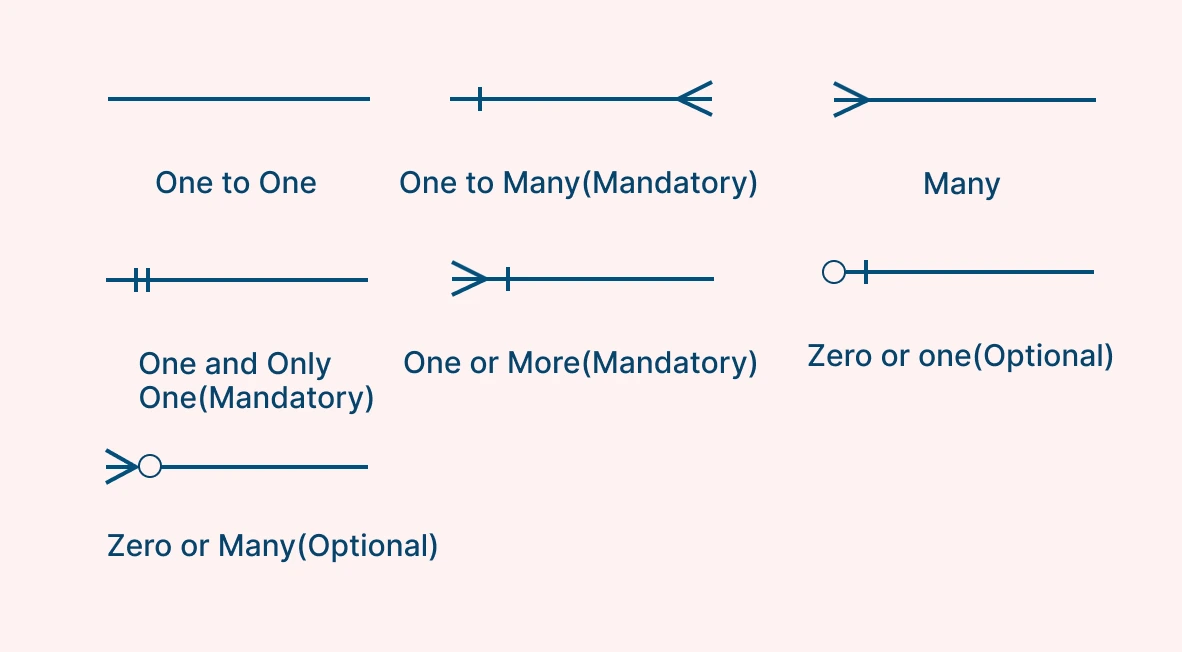
ERD Symbols and Notations#
